It has been truly a historic and tumultuous six months to start 2022, and investors have been hurting across the risk spectrum. With the global 60/40 portfolio returning -17.5%, the 3rd worst start to a year for moderate investors in recorded financial history, and stock/bond correlations sitting at 20 year highs, multi-asset investors have “nowhere to hide.”
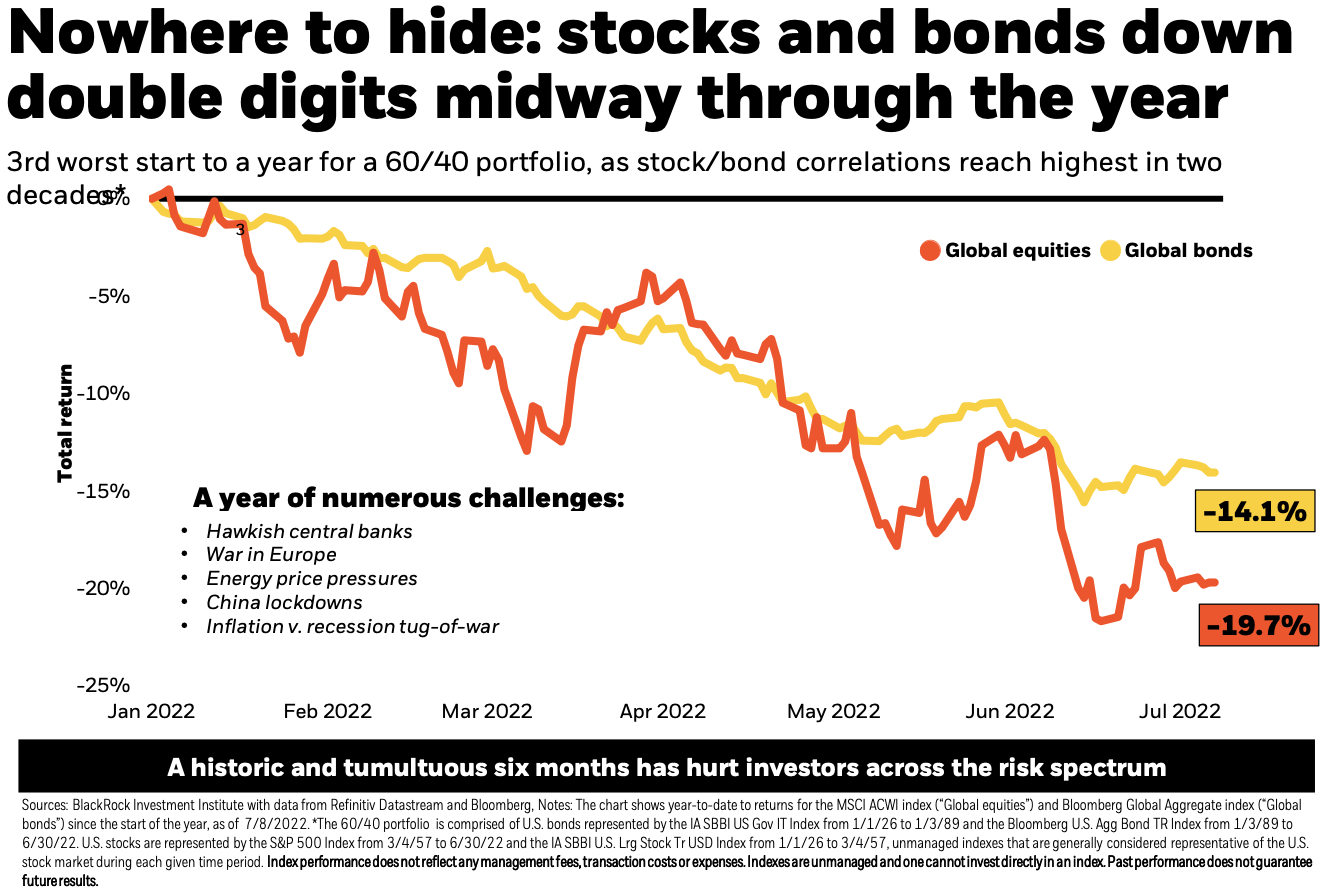
We are in the midst of a regime shift - which brings uncertainty and volatility. The “pre-pandemic regime” extending from the mid-1980’s through the start of the Covid pandemic saw moderate growth and a demand driven economy supporting remarkable stability in both economic output and inflation. We expect this new “post pandemic regime” to be characterized by persistent inflation, erratic production output, and short economic cycles.
Challenges today are creating global production and supply chain constraints, hampering the economy, and driving up inflation. Central bankers face a difficult tension in considering how to contain inflation - do they hinder economic growth with rate hikes or live with higher inflation?
In the face of this balancing act, our portfolios will need to stay agile, nimble, and deliberate in the management of active risk.
Key Takeaways
Hot & sticky (but backward looking) inflation
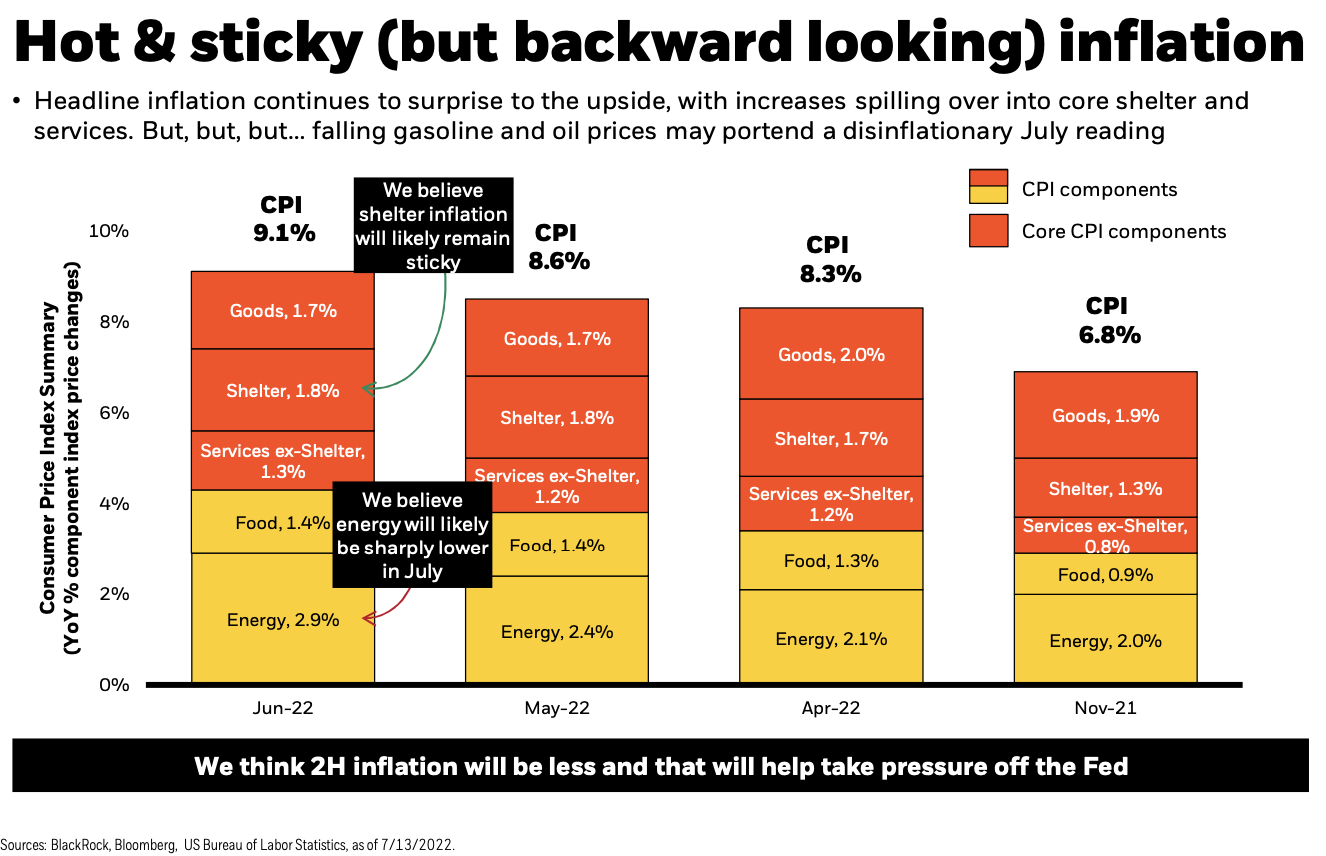
Elevated inflation has been a dominant theme the past few quarters. Largely driven by Energy costs approaching 3%, the CPI (Consumer Price Index) for June showed an increase to 9.1% from 8.6% the previous month. Most significant has been the broadening of inflationary pressures into “stickier” core components such as shelter and services. This suggests that aspects of the inflation story may be more persistent than previously anticipated.
All that being said, we continue to believe inflation is at or near “peak” levels, and we have already witnessed a meaningful reduction in wholesale gasoline prices, oil prices, and commodity prices over the past two months. In addition, we are seeing signs of supply chain pressures easing such as shipping costs and delivery delays easing, retail inventories building, and user car prices falling.
Our view is that inflation will likely remain well above historical averages and well above the Fed’s target of 2% going forward, but we should start to see a gradual decrease in inflation prints over the second half of 2022.
The Fed has accelerated the pace of price hikes
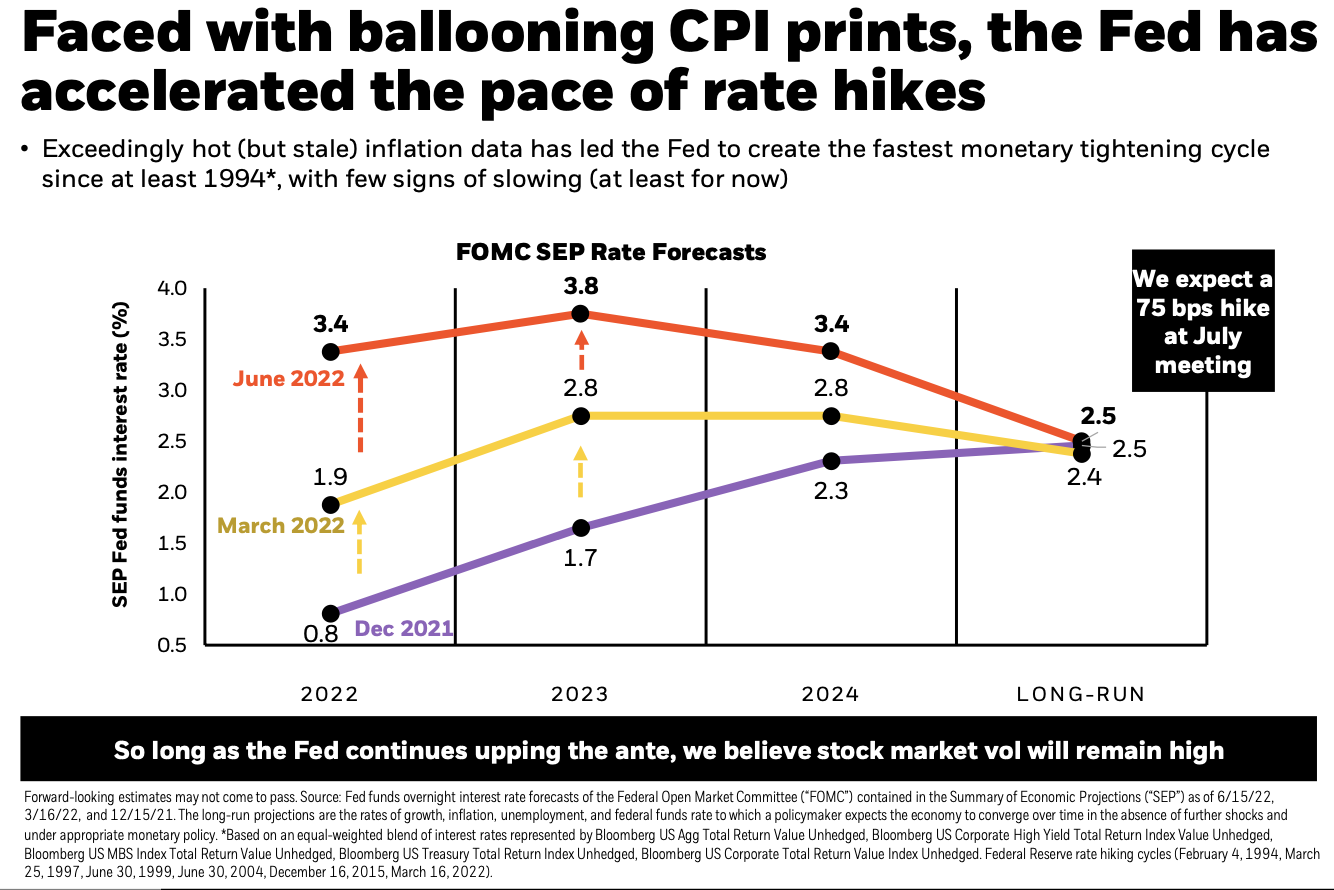
At the time this graph was created, the Fed had raised rates three times this year. As expected in the July meeting, the Fed implemented a fourth rate hike of 75 bps, setting a target range of 2.25%-2.50%. The next meeting is scheduled for September.
As the chart suggests above, June’s latest Statement of Economic Projections shows the FOMC’s mean expected policy rate as 3.4% by year end. This marks a greater than 3-fold increase since the start of the year.
Fed officials including Chairman Powell are on record expressing earnest desire not to cause a recession, but the need to stabilize inflation is causing them to project further tightening. This risks an economic contraction.
Our view is that raising rates is an imperfect tool - while it can shock demand, it can’t directly impact inventory or supply chain issues, two factors that are driving inflation in the first place.
A stubborn Fed could lead to a recession
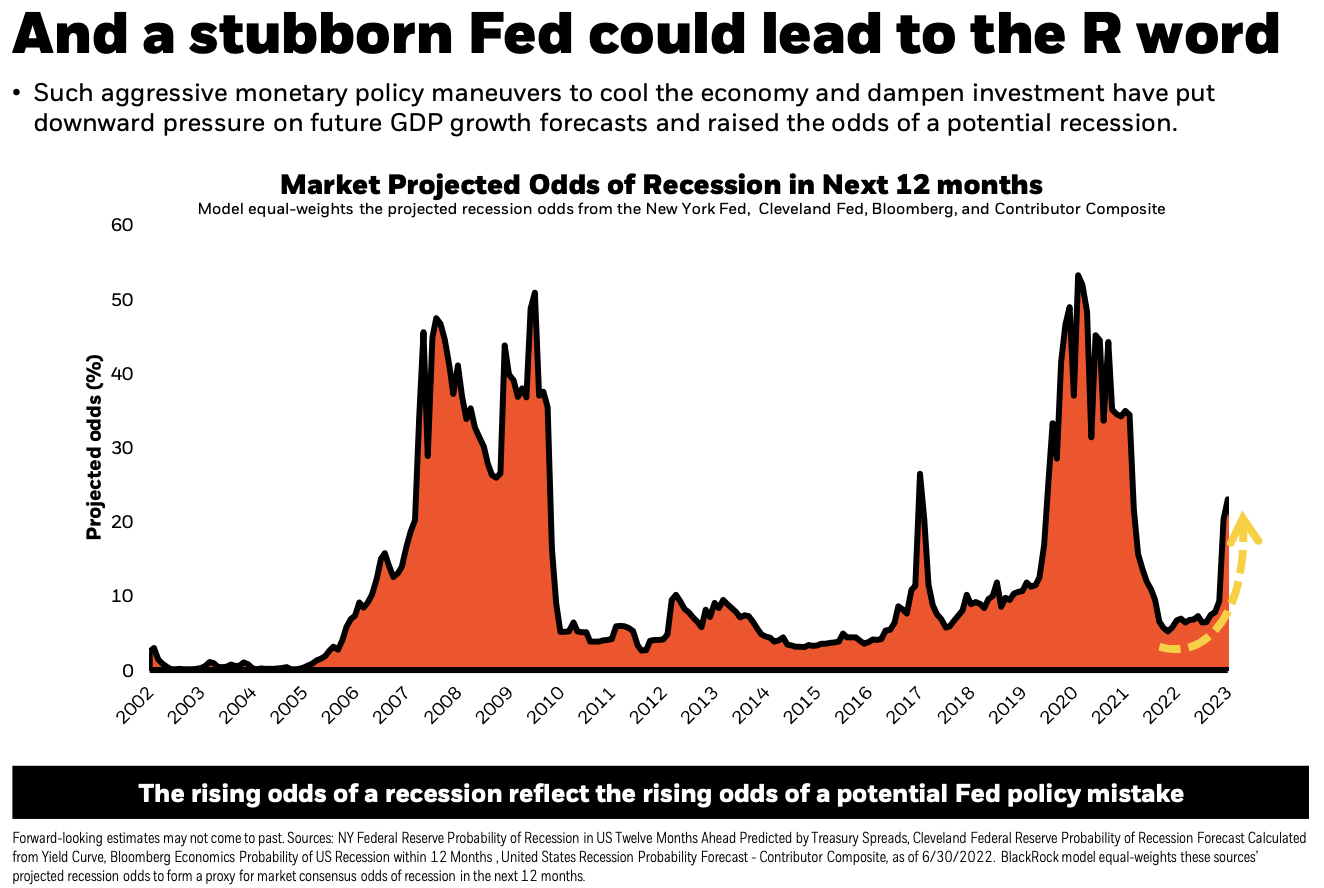
As the Fed continues to double down on its commitment to fighting inflation, the chance of potential policy error has increased - the risk that overtightening could tip the economy into a recession. Since first quarter GDP growth came in at a surprising -1.4% annualized, we should experience a “technical” recession with a second quarter of negative GDP growth.
In the chart above, you see a model of equal weighted recession odds over the next 12 months from the New York Fed and Cleveland Fed. Based on the metric, there has been a dramatic uptick in projected odds of recession in recent months. In June 2021, the odds were below 10% on average for the coming year. Now a year later, the odds by this time next year have almost tripled.
Underlying financial health of corporates and consumers unusually strong
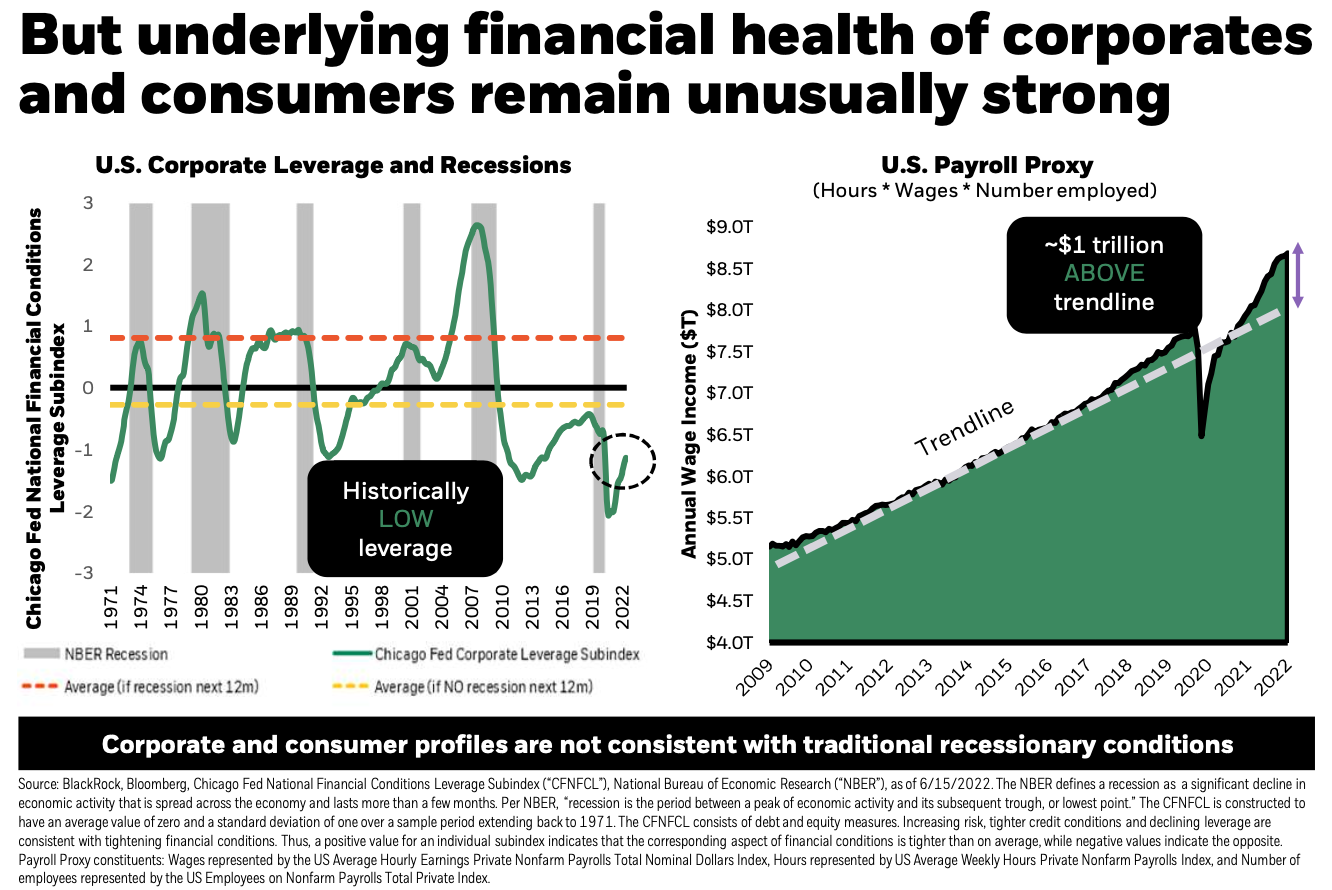
While the odds of recession may be increasing, it is important to note that corporations and consumers still appear strong. As an example, the U.S. corporate sector came into this year with record margins and balance sheets still have some $4TR in cash.
The chart above, on the left-hand side, shows the Corporate Leverage Index. This is one of three subindexes of the Chicago Fed’s National Financial Conditions index (alongside Risk subindex and Credit subindex). In the months preceding each of the last 6 recessions since 1971, corporate leverage typically creeps up into the 0-1 range. As you can see, we are still at a historically LOW average for 2022.
We also continue to see strength in most U.S. consumer data, bolstered by low unemployment and healthy personal income levels. The chart on the right-hand side shows U.S. Payroll Proxy, a metric based on hours worked multiplied by wages and the number of people employed. In 2022, we are still about ~1T above the trendline since 2009.
Spending has continued on-trend, and we continue to have unemployment holding steady at 3.6%. All of these factors taken together imply there may be some resiliency cushioning against a potential downturn.
Job market potentially more fragile than it appears
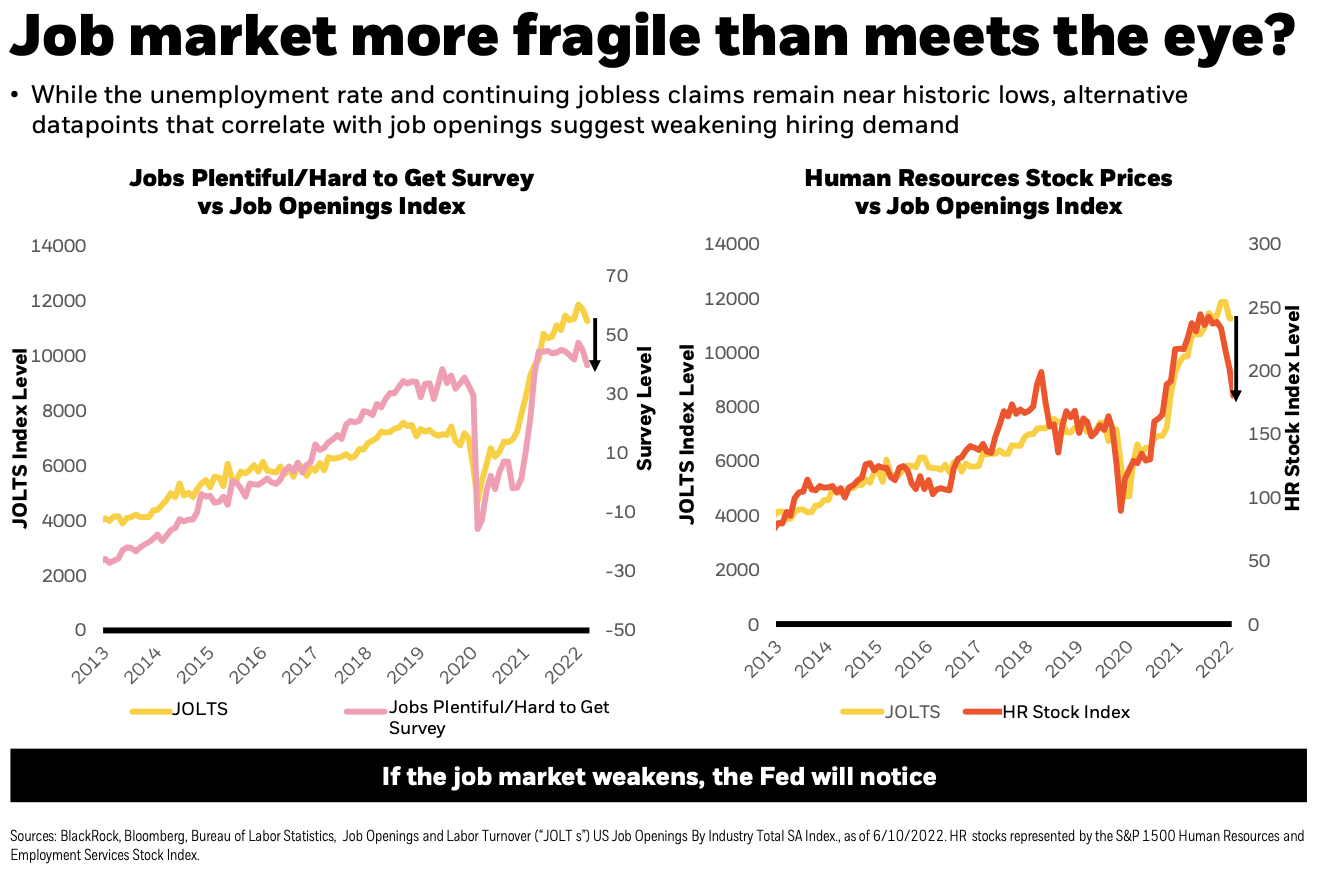
Wage growth is key to the outlook for inflation, Fed policy, recession risk, and ultimately, the bull/bear case for stocks and bonds. Cooling wages means relief on inflation and less aggressive Fed tightening, while persistent strength in wages comes with stick price pressures and a hawkish Fed.
Judging the strength of the labor market exclusively by unemployment rates and jobless claims, it looks remarkably tight; however, digging deeper can reveal some potential signals and cracks.
On the left-hand side of the chart above, we see the Jobs Plentiful/Hard to Get Survey. The yellow line represents the Job Openings and Labor Turnover (JOLTS). We see the net jobs level (yellow line) is still elevated vs pre-covid levels. This tells us that hiring continues to outpace quits overall. At the same time, the pink line (Jobs Plentiful/Hard to Get Survey) shows a recent downtick. This indicates that job seekers broadly think jobs are becoming harder to get.
On the right hand side, we see JOLTS data compared to HR Stock prices, essentially all publicly traded companies involved in recruiting and human resource management. The companies have seen notable price decline over the last 6 months, indicating that markets are pricing in less revenue and pricing power (due to a slowdown in hiring)
The current labor market’s conflicting data points should continue to be examined and reviewed moving forward.
Rapid deceleration in money growth could lead to easing financial conditions
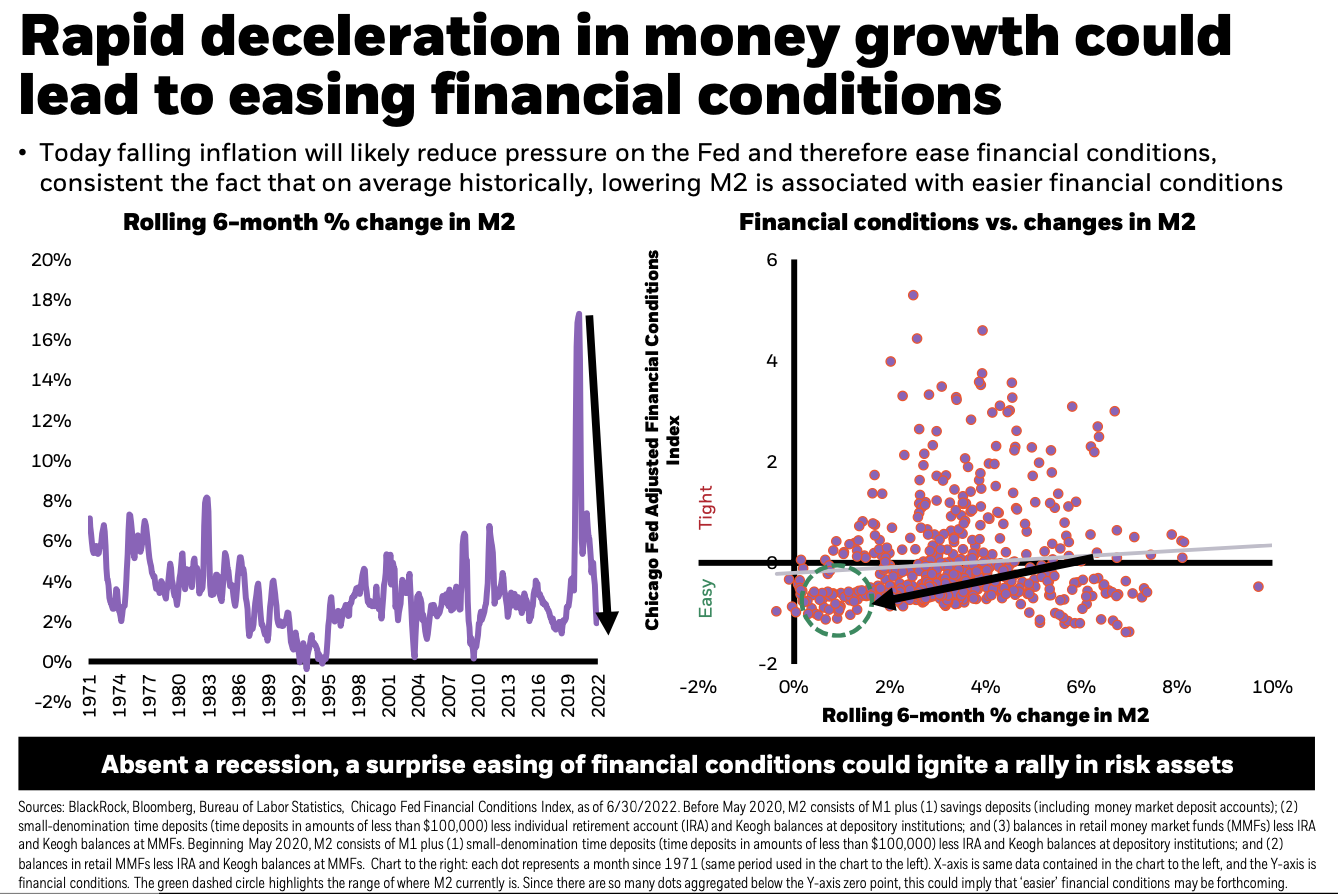
The money supply growth (M2) has plunged below the 50yr average, which historically coincides with easing financial conditions. This rapid rate of money supply collapse may surprise market participants and serve as a positive catalyst for risk assets (absent a full blown recession).
U.S. real GDP growth is more highly correlated with changes in Global Short Rates than with changes in fed funds. We see Global Short Rates have been increasing for 16 months, while fed funds have been going up for four months.
Bank deposits, accounting for ~90% of M2, have fallen into the bottom quartile relative to history, and are heading towards zero growth. If we can continue to see M2 growth remain low, this should eventually help decelerate inflation.