As we grow closer to the end of a turbulent year, we continue to see themes of persistent inflation and market volatility. We examine the Federal Reserve’s commitment to economic tightening through rate hikes, slowing pandemic-era inflation drivers, and other key takeaways moving forward.
Trade Details*
*Tactical changes are dependent upon your investment strategy and risk tolerance.
Our trades reflect a continuation of a year-long trend to reduce risk and build portfolio resilience against a backdrop of heightened uncertainty.
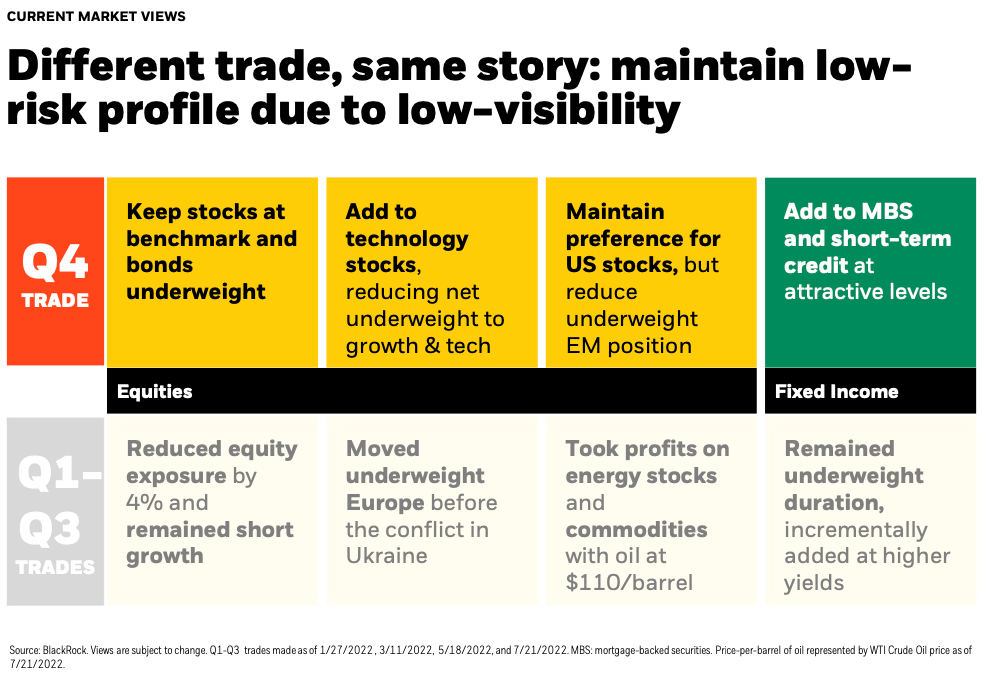
- Keep stock/bond split close to benchmark, and continue to slash active risk
- Bring longstanding value tilt and underweight to growth closer to neutral, buying back into technology stocks
- Remain overweight US stocks, as international economic and inflation outlooks diverge from the US
- Maintain a modest duration underweight position, selling longer-term nominal and inflation-linked US treasuries
Due to heightened market risks with the Fed’s tightening campaign, we have been strategically cutting risk and pruning active bets (exposures that deviate from benchmark) across our models since the middle of last year.
These proactive moves have generally served the models well amidst one of the most challenging periods for investors in modern history, with both stocks nad bonds concurrently falling into bear markets. Consistent with our last several rebalances, we are again shrinking exposure to overall risk and pulling back on existing active views, inching closer to benchmark in almost all respects.
Market Outlook Key Takeaways
Softening inflation still ‘too hot for comfort’
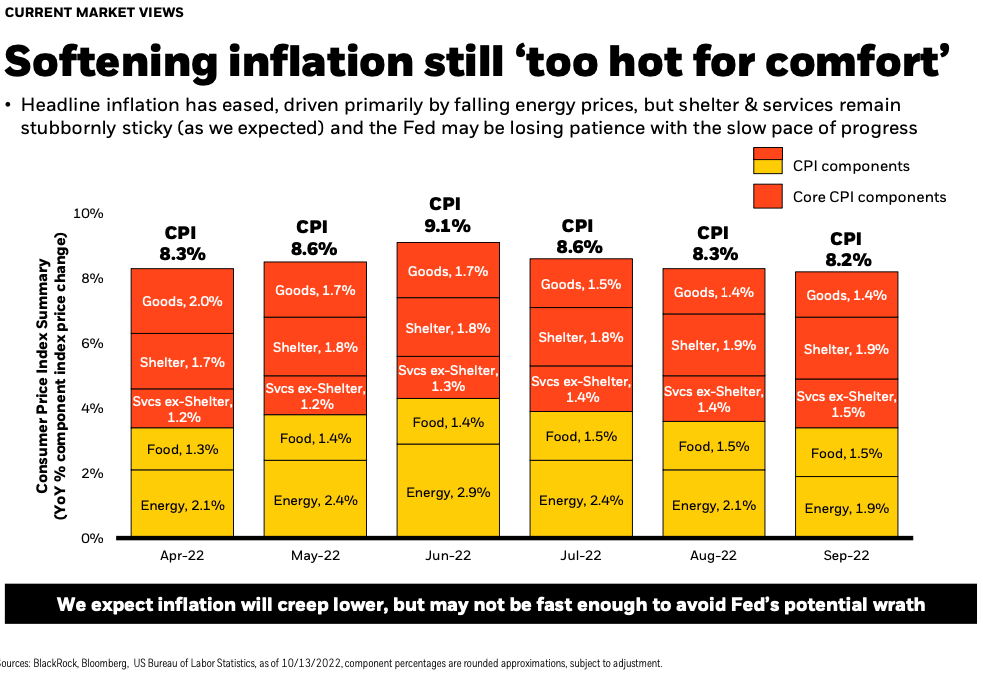
While core inflation has increased, including shelter and service components, headline inflation has eased, driven primarily by falling energy prices. We continue to believe inflation should ease in the coming months; however, this may not happen as quickly as the market or Fed would like. It is worth noting that the official inflation data we rely on is some of the most lagged of data we get, not only in terms of when it gets reported, but also in terms of what it reflects. By the time inflation is in reverse in the economy, we won’t see it in the inflation data for months.
Fed keeps foot on pedal ‘until job is done’
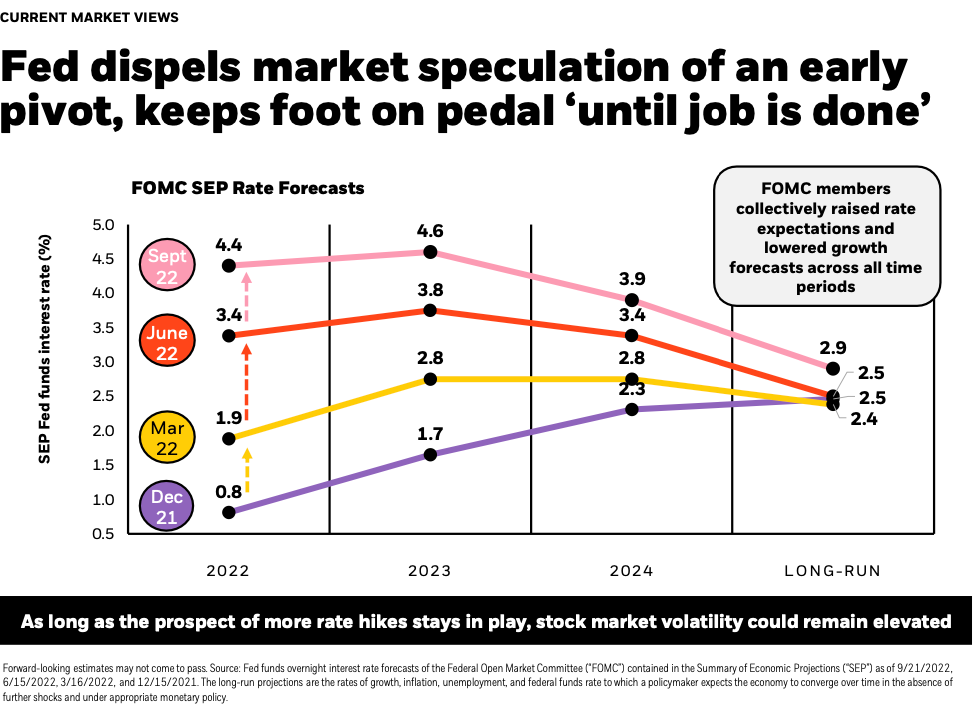
As elevated inflation persists, the Fed has remained committed to aggressive rate hikes aimed at reducing both aggregate demand and economic growth. With the prospect of more rate hikes, we believe stock market volatility is likely to remain elevated moving into 2023.
On the chart you can see the most recent economic projections for the Fed Funds rate looking ahead over the next few years, clearly a more aggressive expectation than what has been priced into markets for much of 2022.
The most recent FOMC minutes showed a continuation of comments reflecting policy makers' concern about doing too little on inflation rather than doing too much. With the long and variable lags of monetary policy, we likely only see the true impact of lowering economic demand for as long as a year from now, in line with historical observations that monetary policy operates with a ~12 month lag.
Falling demand has helped slow many pandemic-era inflation drivers
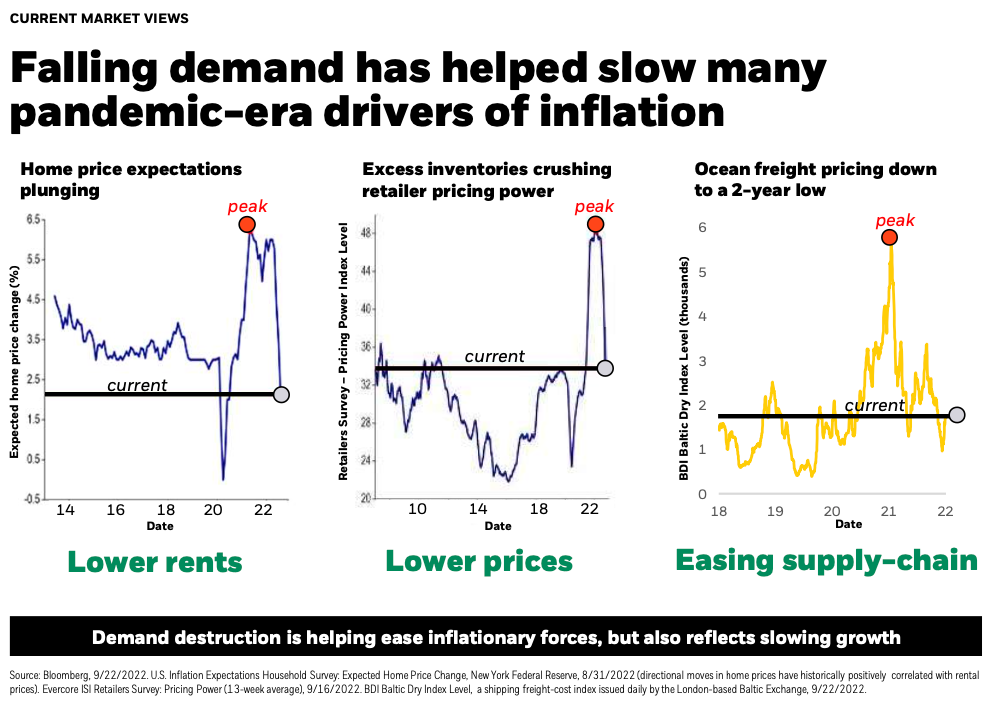
Pandemic-era inflation drivers such as home prices, retailer pricing, and supply chain shortages are easing due to falling demand. As these forces soften, it will continue to put downward pressure on inflation over time.
It is important to remember that inflation is some of the most lagged data we get, so we believe these headline numbers will continue to come down.
Looking at the chart on the left, you can see home price expectations are in rapid decline.
The second chart highlights how excess inventories are having an impact on retailers pricing power, which you can see has fallen off a cliff. We now find ourselves in a market where consumer spending is slowing, investors are shifting preferences from goods back to services, and inventories are likely swollen - so retailers have much less confidence on pricing. We can expect big discounts that can dampen the inflation driver from last year.
One example of supply chain easing is seen in the third chart: ocean freight pricing is now at a 2-year low. Last September, it cost $20,000 to ship a container from Asia to the US, the average price for a freight container now is around $2,720.
Tightening pinch should prompt downward revisions to Wall Street earnings estimates
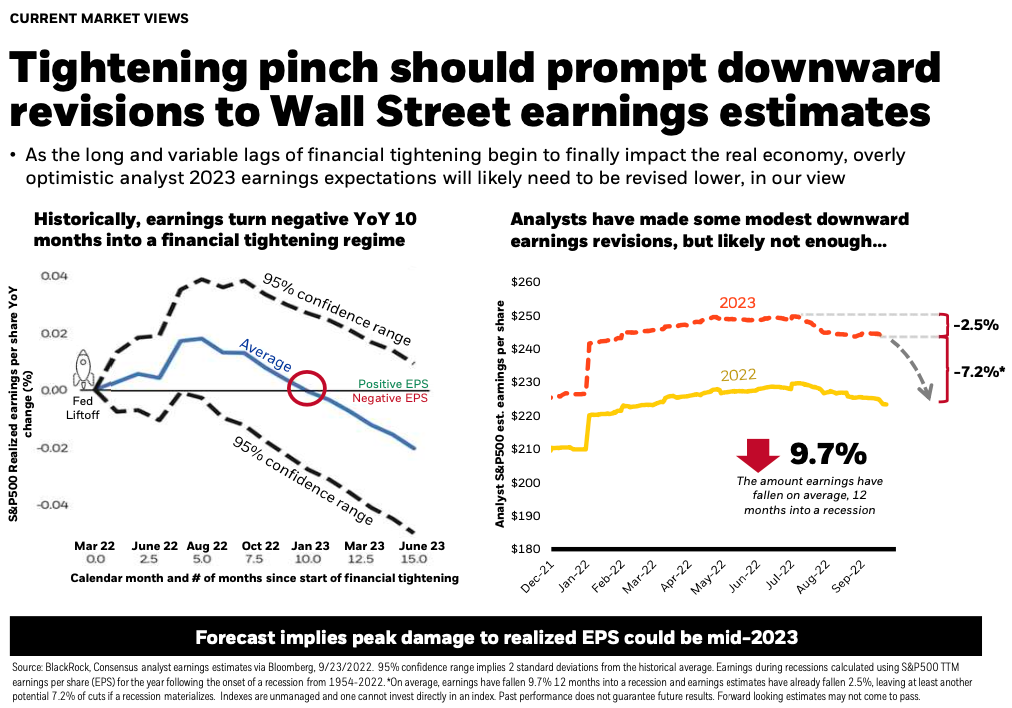
Historically speaking, there is a lag between Fed tightening through rate hikes and the real economy. In our view, the overly optimistic analyst 2023 earnings expectations will likely need to be revised lower, as the long and variable lags of Fed rate hikes finally impact the real economy.
Looking back over the last 70 years, historically in the 12 months after you enter a recession, earnings fall on average about -9.7%. However, there’s a wide range of outcomes for earnings following recession onset which ranges anywhere from down -32% to positive 22%. While it is true that US corporations remain quite healthy and balance sheets are strong as highlighted last quarter, we do see room for expectations to continue to move lower.
Bullish effects of slowing money growth and easing inflation
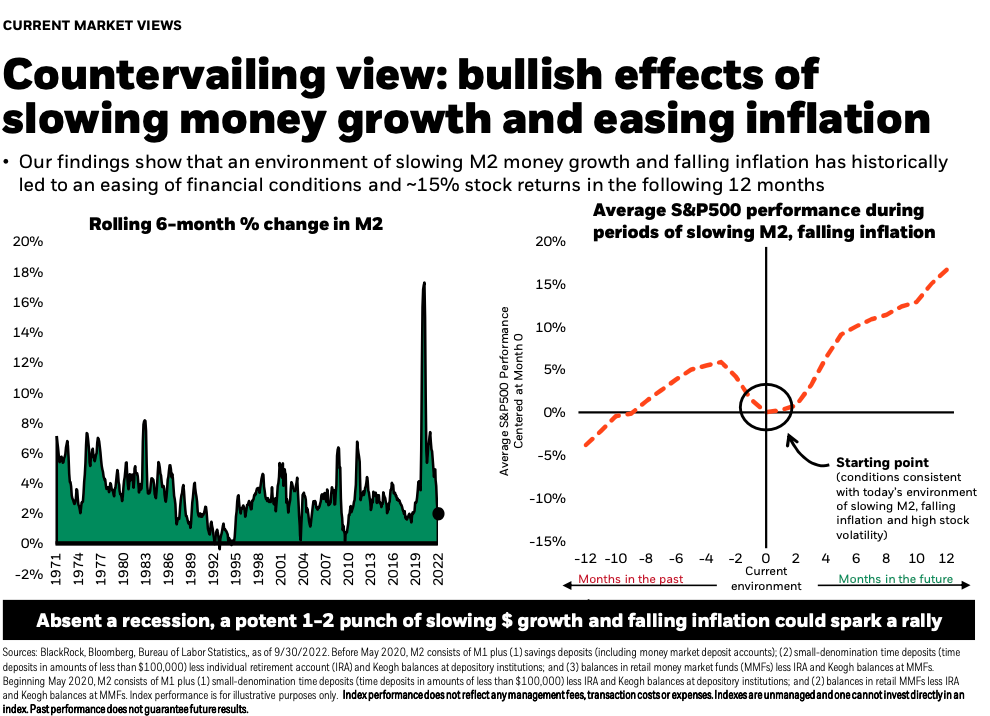
Money supply growth (M2) has plunged below the 50 yr average, which historically coincides with easing financial conditions. If the US economy dodges a recession, this could be a bright spot with expected stock returns around 15% in the next 12 months.
This material presented by MA Private Wealth (“MAPW”) is for informational purposes only and is not intended to serve as a substitute for personalized investment advice or as a recommendation or solicitation of any particular security, strategy, or investment product. Facts presented have been obtained from sources believed to be reliable, however MAPW cannot guarantee the accuracy or completeness of such information, and certain information presented here may have been condensed or summarized from its original source. MAPW does not provide legal or tax advice, and nothing contained in these materials should be taken as legal or tax advice. This information may contain certain statements that may be deemed forward-looking statements. Please note that any such statements are not guarantees of any future performance, and actual results or developments may differ materially from those discussed. No investor should assume future performance will be profitable or equal the previous reflected performance. MAPW may change its positions regarding the investment discussed herein and possibly increase, reduce, dispose of, hedge, or change the securities without notice. Past performance does not guarantee future results. Consult your financial professional before making any investment decision.
Any reference to an index is included for illustrative purposes only, as an index is not a security in which an investment can be made. They are unmanaged vehicles that serve as market indicators and do not account for the deduction of management fees and/or transaction costs generally associated with investable products. The holdings and performance of client accounts may vary widely from those of the presented indices.