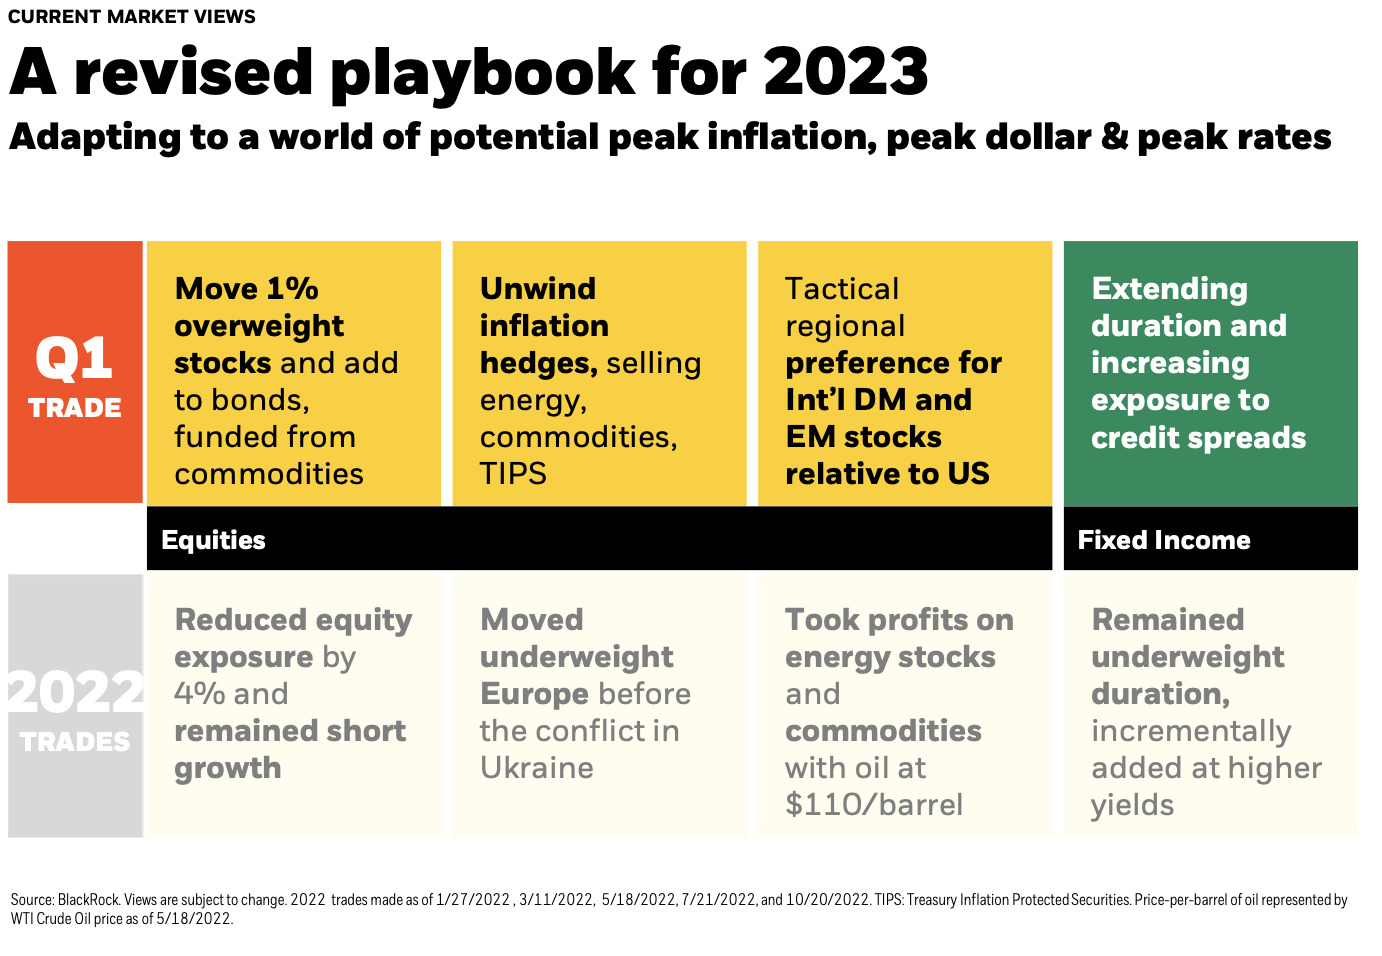
It was a challenging market environment in 2022. Looking forward, 2023 needs a revised playbook. We are now looking to adapt to a world of potential peak inflation, peak dollar, and peak interest rates. We examine key market insights and takeaways below.
Trade Details*
*Tactical changes are dependent upon your investment strategy and risk tolerance.
-
- Move 1% overweight stocks and add to bonds, funded from commodities
- Remove inflation hedges (commodities, energy and TIPS) given our belief that inflation is decelerating
- Adding to Developed Markets (DM) and Emerging Markets (EM) equities, reducing U.S. equity exposure
- Adding to credit spreads and duration, while looking to tap into attractive fixed income sectors
Market Outlook Key Takeaways
Potential Turning Point
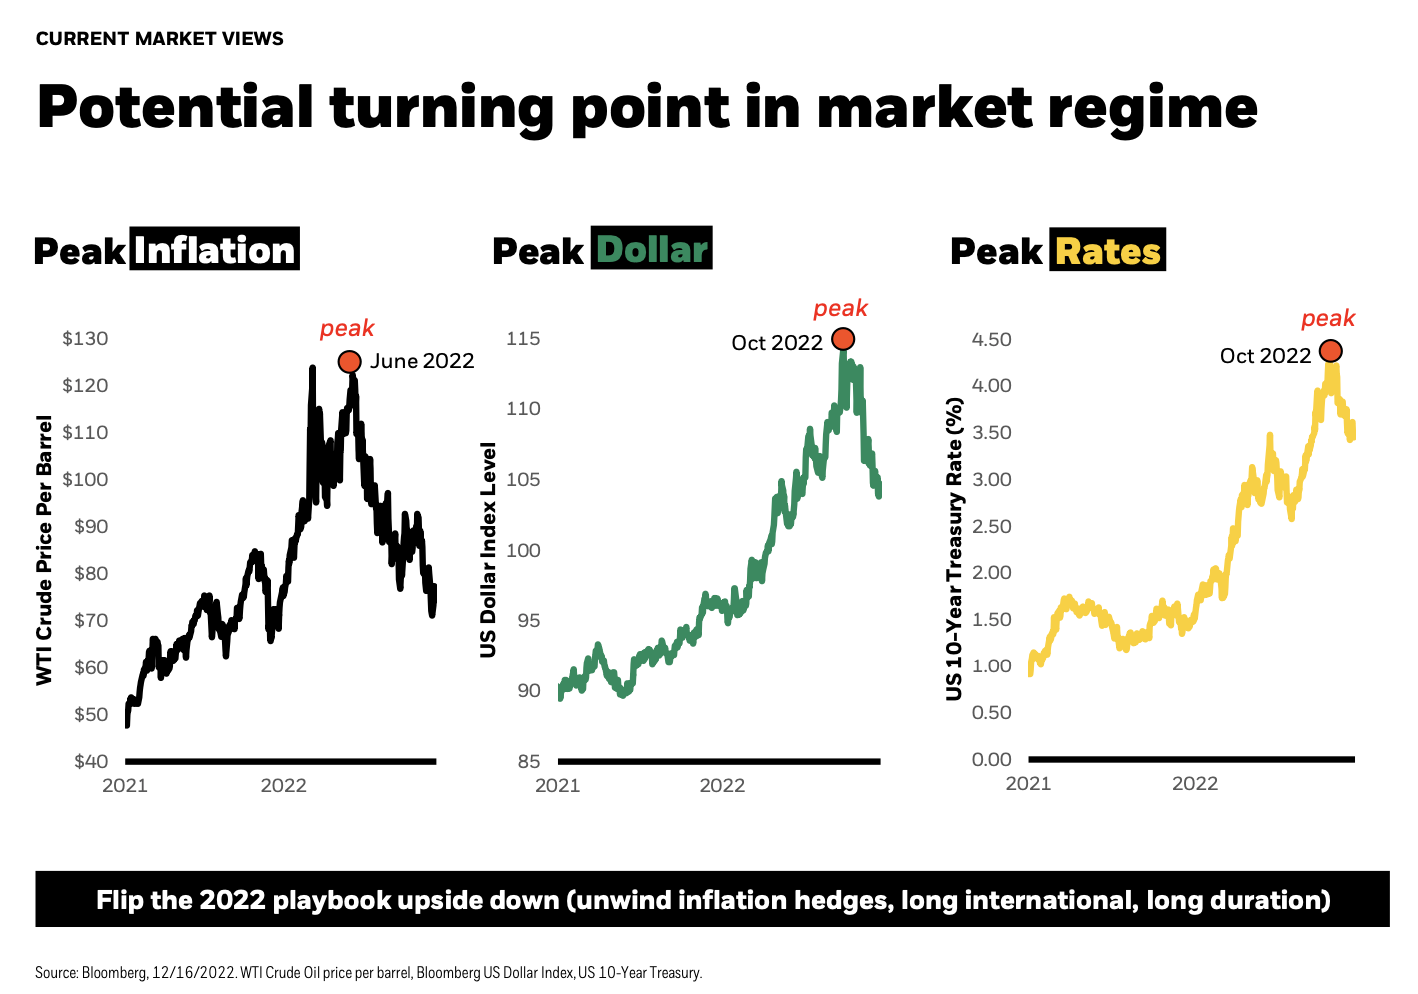
A market shift may be underway with three key indicators.
- WTI Crude’s barrel price is still on the decline since June 2022, showing potential peak inflation. The price per barrel has dropped by about 40%, staying in the 70-74% range since December 9th.
- The U.S. Dollar soared in 2022, but has dropped since October, showing a potential relative peak in the value of the dollar. The dollar index fell about 8% through the end of the year as traders slashed long-dollar positions. Even with a dollar rally in the early days of 2023, the index is still well below the 2022 peak.
- The US 10-Year Treasury rate has decreased since October, showing potential peak interest rates. Down from 4.2% in October to 3.7% in the early days of 2023, the rate is down even with the Fed reiterating a commitment to higher rates.
Trajectory of inflation becoming convincing
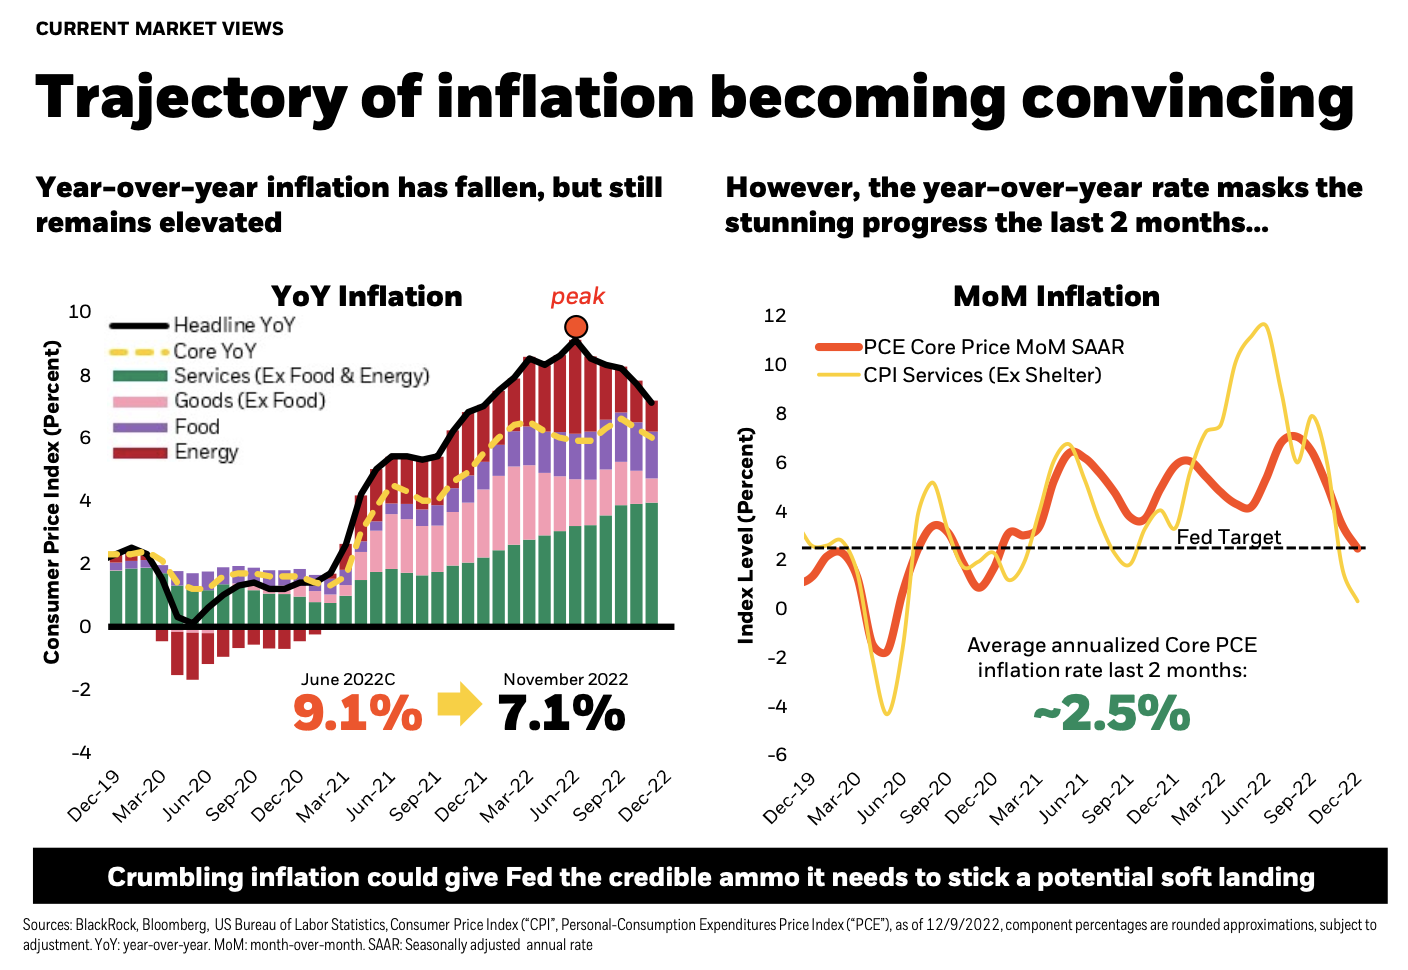
Year over year inflation remains elevated, but rates have decreased rapidly over the last two months. Many market participants focus on the data in the graph above to the left. It shows the headline year-over-year Consumer Price Index; however, since inflation components such as shelter are extremely lagged, this is looking in the rearview mirror, not forward.
To focus on the future path of inflation, look at the month-over-month Consumer Price Index shown in the chart on the above right. The month by month data shows that inflation is on the decline.
Makeup of Fed voting members to change
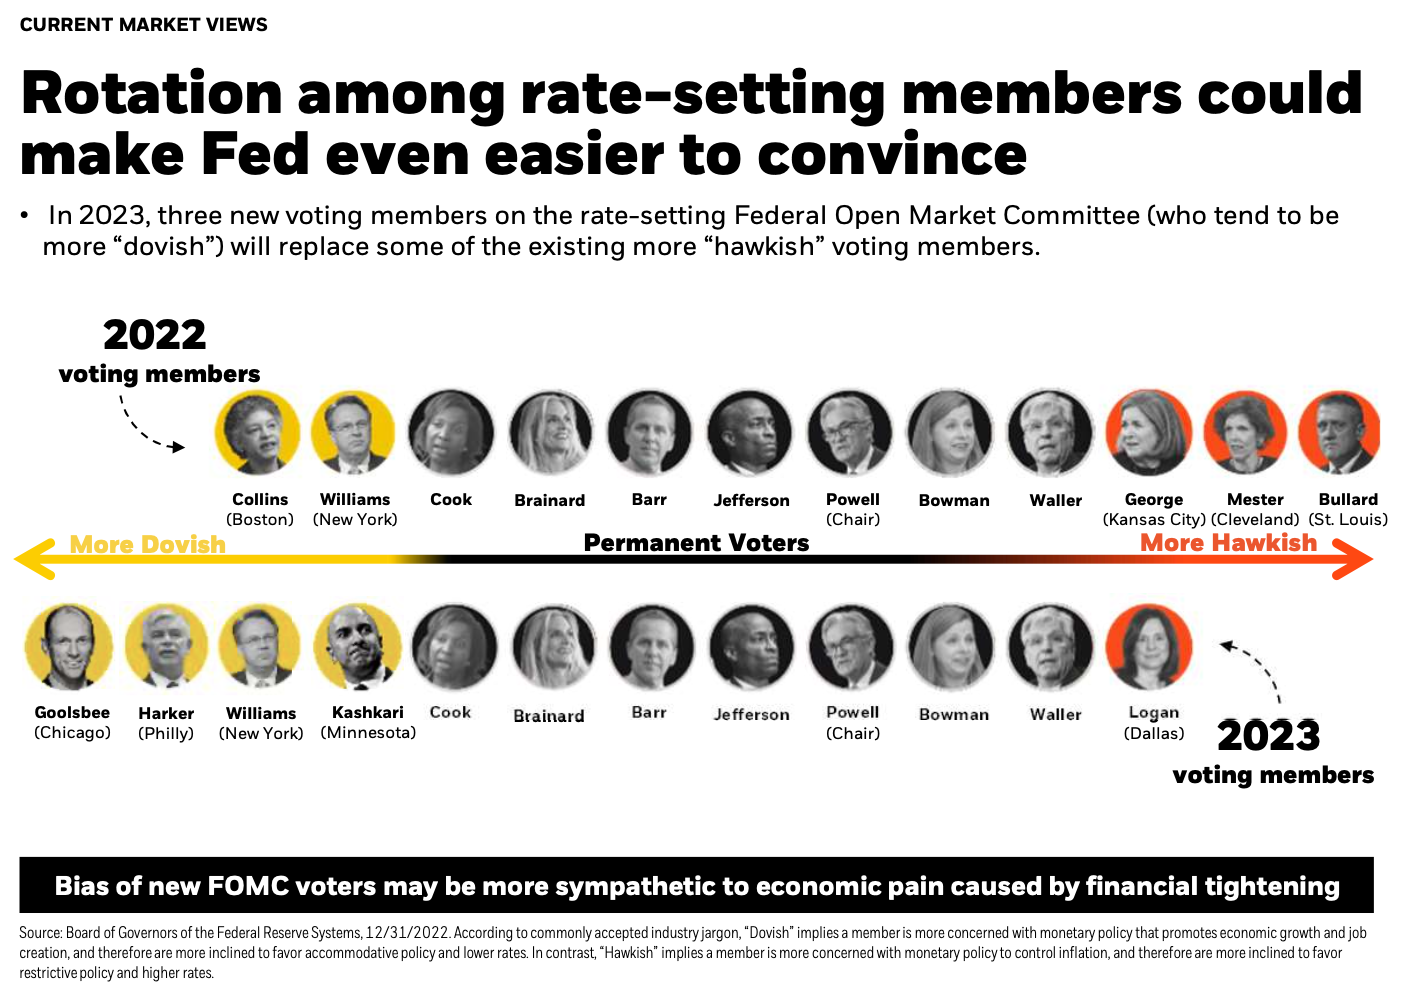
Three new Federal Open Market Committee (FOMC) voting members will join and three will leave in 2023. The three joining may be less likely to raise interest rates than the three leaving.
The implication here is we may find ourselves with a committee that is more sympathetic to job losses, higher unemployment, or broader economic pain. Recent Fed speeches indicate that more “hawkish” caveats like “keeping at it until the job is done” as less frequently being expressed. Instead the financial press’ narrative has been all about a pause in rate hikes. If inflation continues to decrease, it is feasible that in March we start to see that pause manifest.
EM rallies historically coincide with US dollar peaks
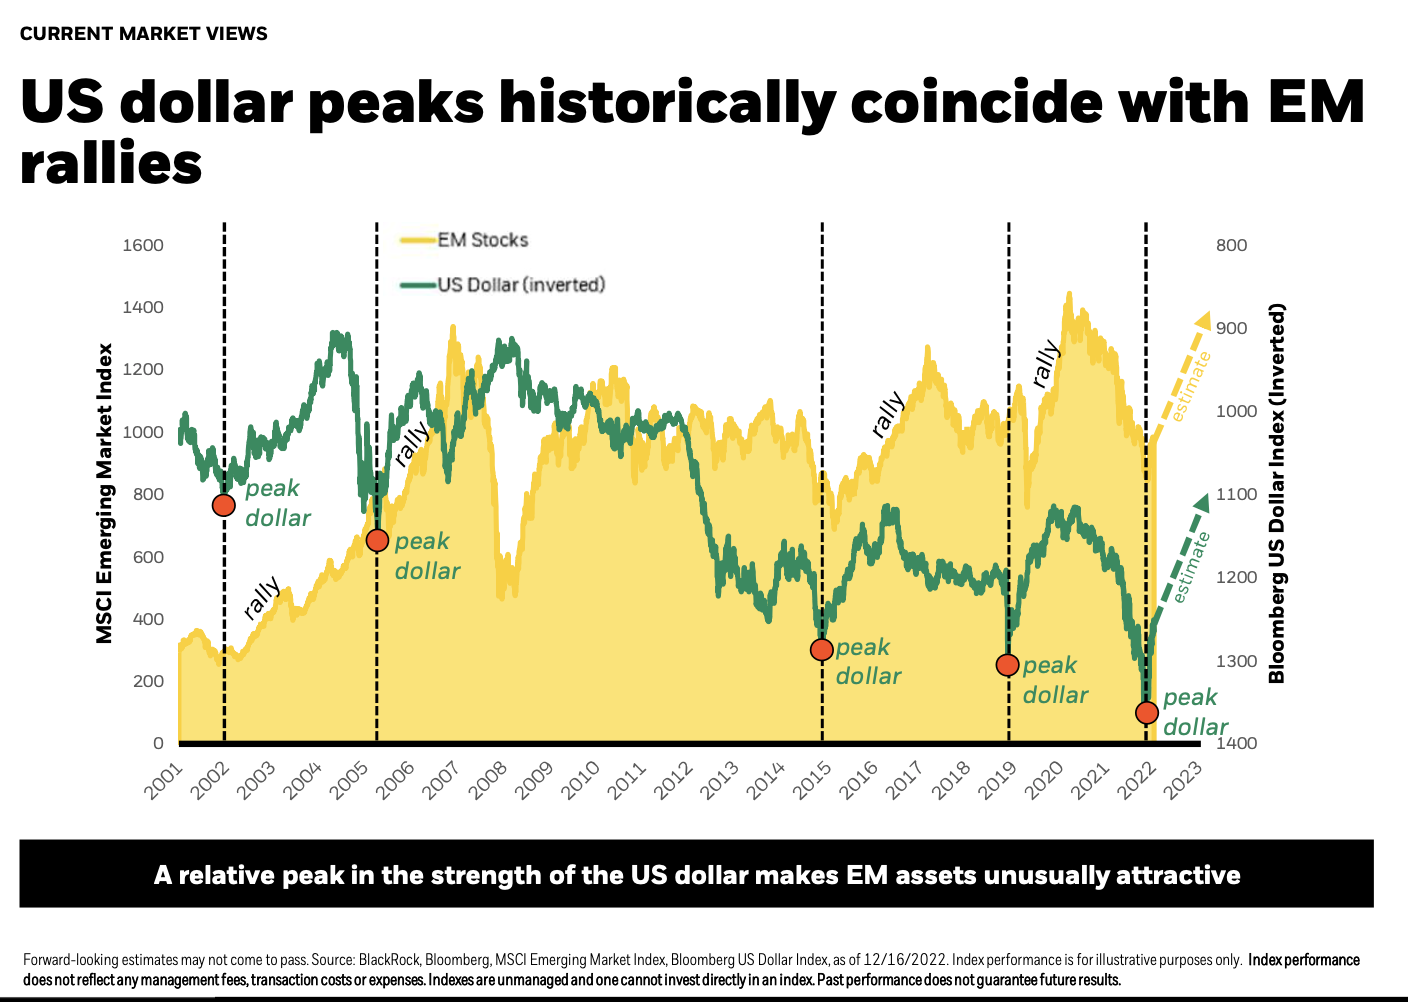
Emerging market equities are an attractive position right now. While we know past performance is no guarantee of future behaviors, historically, a relative peak in the strength of the US dollar can foreshadow a rally in EM stocks.
Overseas corporate earnings show growing strength
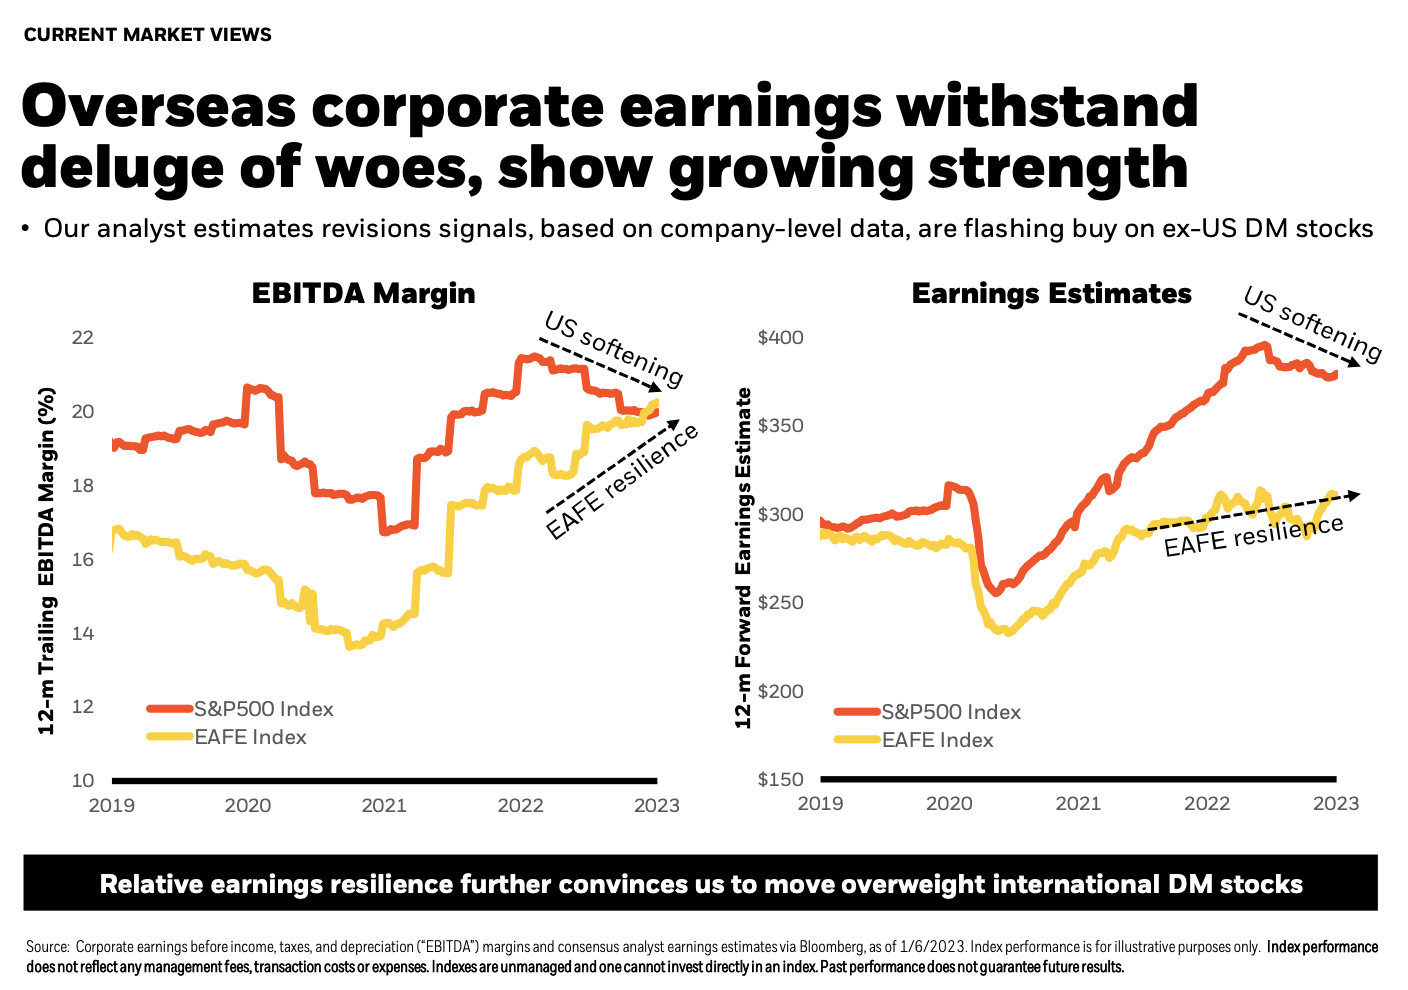
One of the challenges faced by the region last year were the unknown ramifications over ongoing tensions as a result of the war between Russia and the Ukraine. There were potential implications for the European economy and companies generating the majority of their revenues in the region.
Despite this, as you can see on the chart to the above left, 12-month trailing margins for US firms are compressing, while non-US developed nation margins are increasing.
When you look at the forward-looking earnings estimates from equity analysts, you can see the U.S. earnings estimates softening starting in June 2022. In contrast, the DM market has been steadily strengthening into 2023.
Opportunities arising in fixed income
After a painful 2022, we’ve seen a significant repricing of bond yields. We believe fixed income as an asset class looks quite attractive.
In the chart above, we are plotting the future annual rate of return given the starting point of your yield on the Barclays Aggregate Bond Index, with data going back to 1986 (the inception of the index). Current yields tend to be quite prescriptive for future bond returns. Right now, the yield on the Aggregate is squarely between 4-5%, highlighted in the green bar, and historically when you're in this range, your average return has been about 5.2%.
Any reference to an index is included for illustrative purposes only, as an index is not a security in which an investment can be made. They are unmanaged vehicles that serve as market indicators and do not account for the deduction of management fees and/or transaction costs generally associated with investable products. The holdings and performance of client accounts may vary widely from those of the presented indices. S&P 500 Index is a market capitalization weighted index which represents the broad market for large company U.S. stocks. . The EAFE Index is a stock index offered by MSCI that covers non-U.S. and Canadian equity markets. It serves as a performance benchmark for the major international equity markets as represented by 21 major MSCI indices from Europe, Australasia, and the Middle East. The MSCI Emerging Market Index captures large and midcap representation across 24 emerging market countries. The Bloomberg Dollar Spot Index (BBDXY) tracks the performance of a basket of 10 global currencies against the U.S. dollar The Bloomberg Aggregate Bond Index broadly tracks the performance of the U.S. investment-grade bond market and is composed of investment-grade government and corporate bonds.
This material presented by MA Private Wealth (“MAPW”) is for informational purposes only and is not intended to serve as a substitute for personalized investment advice or as a recommendation or solicitation of any particular security, strategy, or investment product. Facts presented have been obtained from sources believed to be reliable, however MAPW cannot guarantee the accuracy or completeness of such information, and certain information presented here may have been condensed or summarized from its original source. MAPW does not provide legal or tax advice, and nothing contained in these materials should be taken as legal or tax advice. This information may contain certain statements that may be deemed forward-looking statements. Please note that any such statements are not guarantees of any future performance, and actual results or developments may differ materially from those discussed. No investor should assume future performance will be profitable or equal the previous reflected performance. MAPW may change its positions regarding the investment discussed herein and possibly increase, reduce, dispose of, hedge, or change the securities without notice. Past performance does not guarantee future results. Consult your financial professional before making any investment decision.