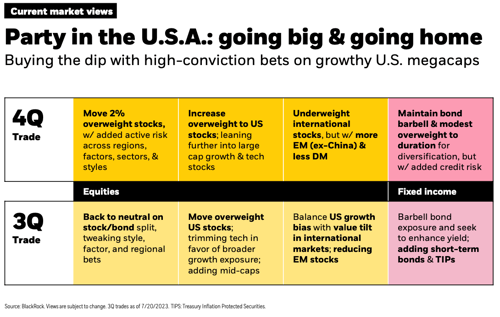
Here is an overview of trade details for Q4. Below, we examine key market insights and takeaways.
Trade Details*
*Tactical changes are dependent upon your investment strategy and risk tolerance.
-
- Cautiously moving to a more “risk-on” stance by adding 2% to stocks
- Adding some credit risk in fixed income heavy models
- Outside of U.S., selling Developed Markets (DM) equities to add to U.S. and Emerging Markets (EM) equities
- Trimming the bond sleeve to buy stocks, selling broad benchmark exposures or TIPs and adding credit risk
Market Outlook Key Takeaways
September Downturn Signals Buying Opportunity
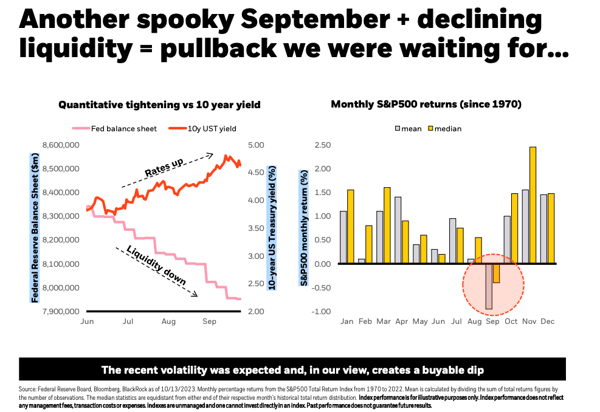
In September 2023, the combination of historically weak market trends and declining liquidity led to a drop in stock and bond prices. This decline, however, might offer an investment opportunity, given signs of resilience in U.S. economic activity.
Earlier in the year, the Federal Reserve intervened to bolster credit and liquidity markets after regional bank failures, but their balance sheet has since been reduced by $400 billion. Data shows September has historically been a challenging month for investors, but the fourth quarter often demonstrates market strength.
Given past market trends and the current scenario, there seems to be a potential for a robust market performance in the upcoming months.
U.S. Economic Growth Surpasses Expectations
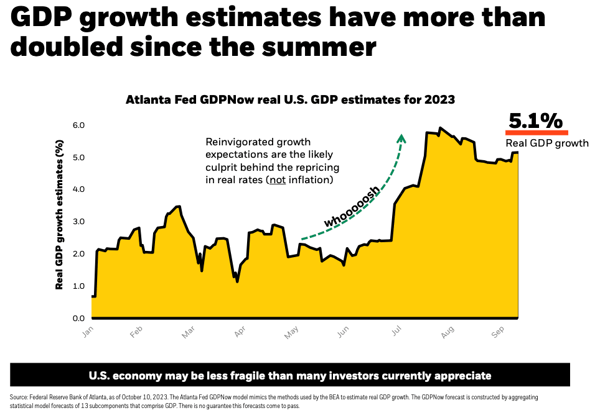
Since the summer, GDP growth estimates have more than doubled, driven by robust U.S. macroeconomic data including retail sales and durable goods. Despite challenges like higher rates and tightened credit, consumers are still spending, evidenced by a 0.7% increase in retail sales in September.
Pandemic-induced excess savings are predicted to last into next year. On the corporate side, effective interest rates have increased only slightly due to effective management of maturities, ensuring no immediate credit challenges.
The Atlanta Fed's GDPNow model forecasts a 5.1% growth for Q3 2023, suggesting consistent economic expansion rather than an imminent recession.
Tech Earnings Rise, Outpacing Broader Market
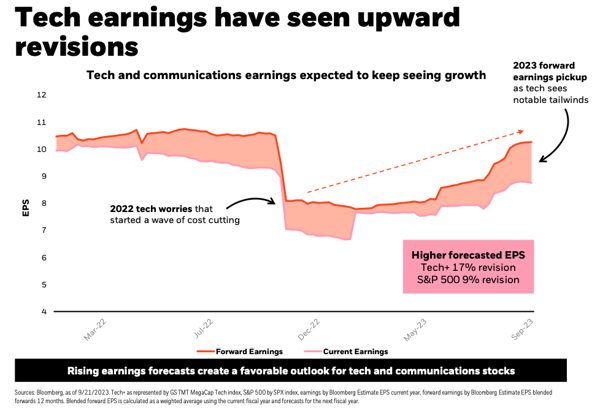
Economic growth indicators have risen alongside an increase in earnings, particularly in the Tech sector. Forward earnings predictions for Tech began rising in July, paralleling rate and economic growth increases, largely due to positive earnings surprises in Tech.
Despite overall optimism in equity markets and a three-month rise in forward earnings growth expectations, the projection for "Tech plus" stands at 17%, compared to 9.8% for the general market. In Q2, Tech earnings shrank less than the broader market.
Moreover, Generative AI's influence on the market is notable, suggesting the dawn of a transformative technological era.
Easing Inflation As Supply Chain Recovers
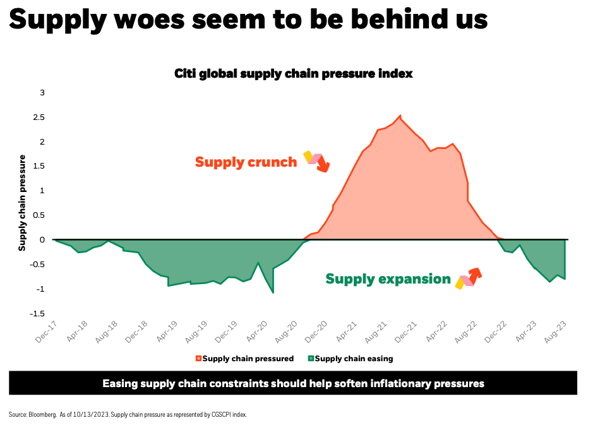
The recent inflation surge was initially triggered by supply chain disruptions due to the Covid pandemic. These supply chain issues peaked during the pandemic and have since returned to more typical levels, suggesting declining prices and increasing productivity.
The latest data indicates that core services, especially housing costs, are primarily driving current inflation. However, real-time market data indicates a cooling in rents, which is expected to reflect in inflation metrics with a delay.
The latest core inflation data shows a decrease to 4.15% from 4.3%, indicating a trend toward the Federal Reserve's 2% target.
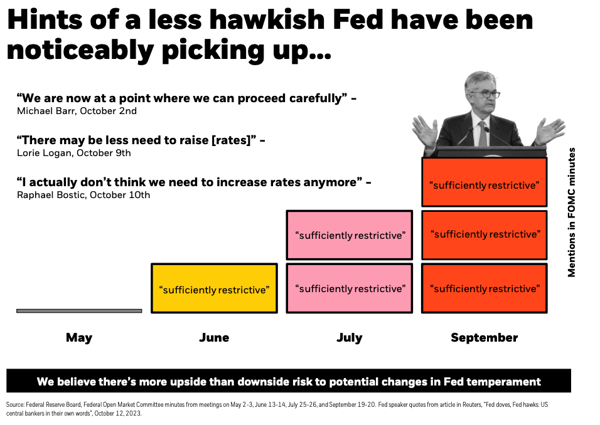
Fed’s Hawkish Stance Softening
China’s Market Struggles Post-COVID
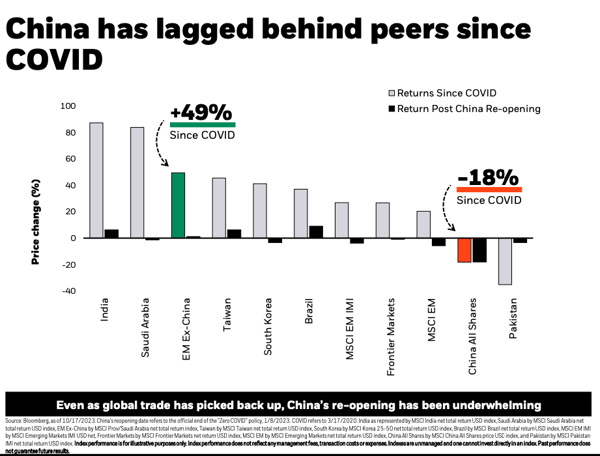
Since the onset of COVID, China's market performance has notably lagged behind other emerging markets. While other emerging markets excluding China have seen a 49% increase, China's market has declined by 18%.
The anticipated boost from China's reopening, countering the effects of their three-year Zero-COVID policy, failed to materialize, and high economic growth expectations were not met. The declining property market, weakened consumer confidence, and other unsatisfactory data further dampened investor sentiment.
Notably, the Chinese market now shows minimal sensitivity to earnings revisions, disconnecting from its traditional correlation with earnings, making it challenging for investment strategies that prioritize earnings metrics.
Mega-Cap Stocks Opportunity
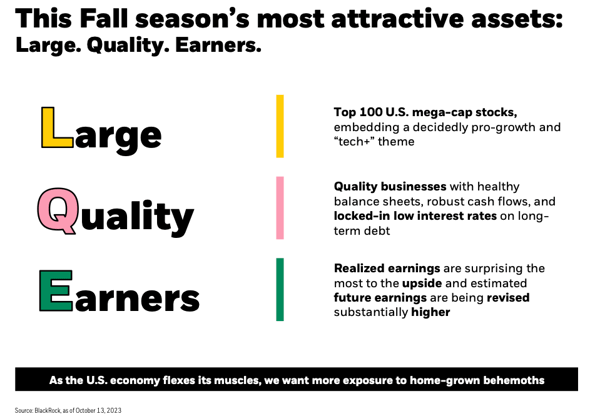
Amid the current economic landscape, there's a strong inclination towards U.S. Growth and technology sectors, particularly in major U.S. stocks which exhibit promising growth trends.
Despite the significant market push by the "Magnificent 7" throughout the year, some big tech stocks experienced a summer downturn, dropping more than 10% from their highs. These tech names are now more affordable than they were at the beginning of 2021.
Earnings forecasts for this group remain optimistic, with an anticipated 20% increase in net income in 2024. With peak interest rates on the horizon, any potential decrease in yields may further benefit tech stocks.
Moreover, mega-cap stocks consistently show higher quality metrics compared to their smaller counterparts, suggesting that historically, after a period of underperformance, quality stocks tend to rebound in the subsequent years.
Any reference to an index is included for illustrative purposes only, as an index is not a security in which an investment can be made. They are unmanaged vehicles that serve as market indicators and do not account for the deduction of management fees and/or transaction costs generally associated with investable products. The holdings and performance of client accounts may vary widely from those of the presented indices. S&P 500 Index is a market capitalization weighted index which represents the broad market for large company U.S. stocks. . The EAFE Index is a stock index offered by MSCI that covers non-U.S. and Canadian equity markets. It serves as a performance benchmark for the major international equity markets as represented by 21 major MSCI indices from Europe, Australasia, and the Middle East. The MSCI Emerging Market Index captures large and midcap representation across 24 emerging market countries. The Bloomberg Dollar Spot Index (BBDXY) tracks the performance of a basket of 10 global currencies against the U.S. dollar The Bloomberg Aggregate Bond Index broadly tracks the performance of the U.S. investment-grade bond market and is composed of investment-grade government and corporate bonds.
This material presented by MA Private Wealth (“MAPW”) is for informational purposes only and is not intended to serve as a substitute for personalized investment advice or as a recommendation or solicitation of any particular security, strategy, or investment product. Facts presented have been obtained from sources believed to be reliable, however MAPW cannot guarantee the accuracy or completeness of such information, and certain information presented here may have been condensed or summarized from its original source. MAPW does not provide legal or tax advice, and nothing contained in these materials should be taken as legal or tax advice. This information may contain certain statements that may be deemed forward-looking statements. Please note that any such statements are not guarantees of any future performance, and actual results or developments may differ materially from those discussed. No investor should assume future performance will be profitable or equal the previous reflected performance. MAPW may change its positions regarding the investment discussed herein and possibly increase, reduce, dispose of, hedge, or change the securities without notice. Past performance does not guarantee future results. Consult your financial professional before making any investment decision.